
Colour Prediction Chart: How to Read Big Small Trend Charts, 5 Famous Patterns, Hot Numbers and Formula Tricks Tested With Free Coins
Charts are the favourite tool of colour prediction fans. Rows of red and green dots, Big and Small roads, number tables: they make every session look like a puzzle with a hidden answer. This page shows how to read these charts, what the five best known patterns really mean and how hot numbers behave over 1,000 rounds. Our free game draws the chart for you, live.
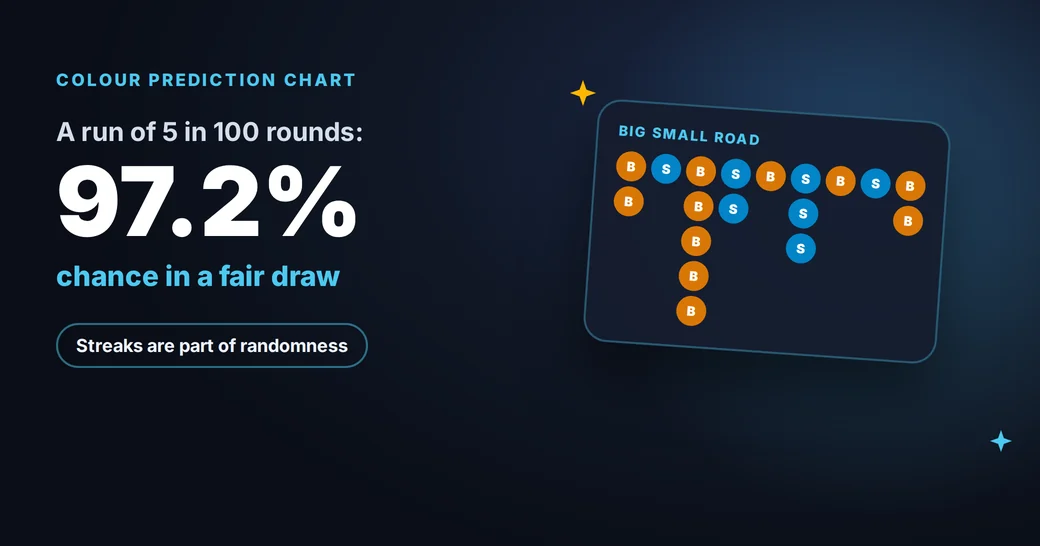
Colour Prediction Chart: 4 Types You Will See
| Chart | What it shows |
|---|---|
| Colour line | the winning colour of each round in order |
| Big Small road | a grid that stacks Big or Small results in columns |
| Number frequency | how many times each number from 0 to 9 appeared |
| Streak counter | the longest run of the same colour or size |
Chart types found in most colour prediction games and in the history panel of our free game, October 2026.
All four charts describe the past. They are an attractive record of what happened in each colour prediction session, and reading them well is a skill in itself, as long as you keep in mind that every chart points backwards, towards rounds that are already finished.
How to Read a Big Small Trend Chart in 4 Steps
- Start from the left, where the oldest results sit.
- Read each column as one run of the same result, Big or Small.
- Note where a new column begins: that is where the result changed.
- Count each column.
A column of six Bigs means six Bigs in a row, and a stretch of short columns means the result changed often. Both shapes are normal in a fair draw. In a series of 100 rounds, a run of five or more of the same size appears 97 times out of 100, as the streak table on the colour prediction hack page shows.
5 Colour Prediction Chart Patterns and What They Mean
| Pattern | What it looks like | What the maths says |
|---|---|---|
| Long run, often called a dragon | one colour or size many times in a row | normal: 7 in a row appears in about half of all 100 round series |
| Zigzag | the result changes every round | as likely as any other sequence of the same length |
| Double pair | two of one result, then two of the other | a common shape, with no effect on the next round |
| Two and one | two of one result, then one of the other, repeating | a shape the eye finds easily in random data |
| Hot number | one number appearing more than the rest | evens out over long series |
Explanations by this guide; streak figure from our calculation for a fair 50/50 draw.
Every colour prediction pattern in the table has the same next step: a fresh round with a 50% chance for each colour and for Big or Small. Patterns are fun to spot. Enjoy them as part of the show.
Watch the patterns form with 1,000 free coins
Hot Numbers: What 1,000 Rounds Look Like
| Number | Times drawn in our 1,000 round sample |
|---|---|
| 0 | 96 |
| 1 | 112 |
| 2 | 88 |
| 3 | 107 |
| 4 | 92 |
| 5 | 92 |
| 6 | 101 |
| 7 | 105 |
| 8 | 104 |
| 9 | 103 |
One simulation of 1,000 rounds by this guide; in 5,000 such samples the most frequent number averaged about 116 draws and the least frequent about 85.
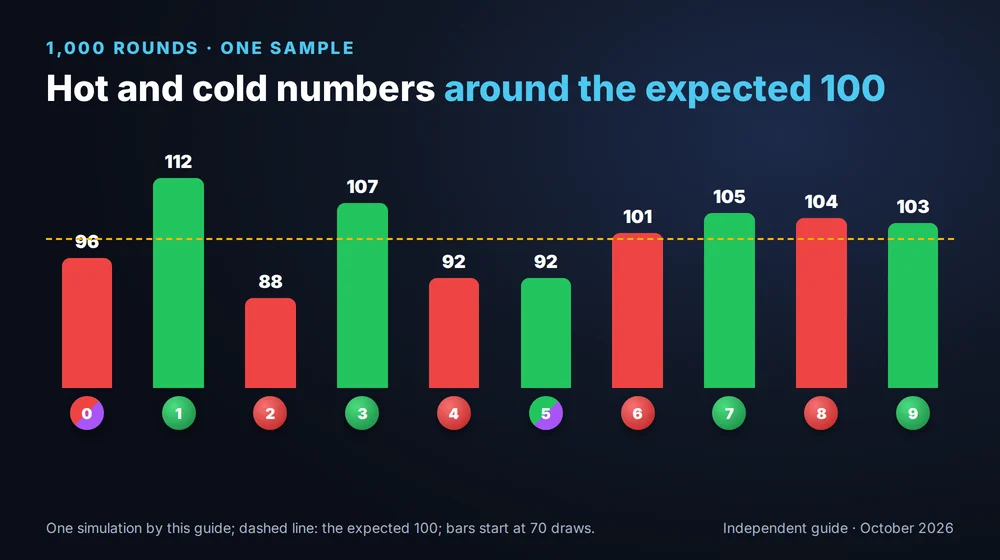
Each number has a 10% chance per round, so the expected figure is 100 draws in 1,000 rounds. In this sample, 1 looks hot with 112 and 2 looks cold with 88. A gap of 20 to 30 between the hottest and coldest number is exactly what randomness produces over 1,000 colour prediction rounds, and it would appear in almost any sample you could draw. In the next sample, other numbers would take those places.
Colour Prediction Formula Tricks: 3 Popular Ones
The first is the doubling formula: double your pick after every miss so that one win covers everything. With 1,000 free coins and a start of 10, the picks grow 10, 20, 40, 80, 160 and 320, and after six misses in a row the seventh pick of 640 no longer fits in the balance. The second is the "due colour" formula, which bets against a long run; in our 100,000 round test it scored 50.2%, the same as a coin. The third is the number trick chart, which picks numbers that have not appeared lately; each number keeps its 10% chance regardless. The free game is the perfect place to try all three and see how they behave over 200 rounds.
Test the doubling formula with free coins
Colour Prediction Chart vs AI: The Same Starting Point
Charts and AI predictors read the same thing. It is the history of colour prediction results. A chart shows it to your eye, while an AI model reads it as numbers. Neither has access to the next draw, which is why both perform like a fair coin in long tests. AI can still help with charts in a useful way, for example by turning a long history into a summary, and the free game does the counting for you automatically.
Draw Your Own Colour Chart in the Free Game
Our free colour game keeps a history panel for every session. It shows the colour line, a Big Small road, the frequency of each number and your longest streaks, all updated after each 30 second round. Play 100 rounds with virtual coins and you will see dragons, zigzags and hot numbers appear on their own. The full rules and controls are on the free colour prediction game page, and the basics of colours and numbers on our main guide to the colour prediction game.
Draw your own Big Small chart for free
Colour Prediction Chart: 4 Questions
How do I read a colour prediction chart?
Read it from left to right, oldest result first. In a Big Small road, each column is a run of the same result, and a new column starts when the result changes. Count the column lengths to see the runs. The chart describes past rounds; each new round still has a 50% chance for each side.
What is the best Big Small chart pattern?
Popular patterns include the long run, the zigzag, the double pair and the two and one. All of them appear naturally. None of them changes the next round. The best use of a pattern is to enjoy spotting it while you play the free game with virtual coins.
Is there a colour prediction formula that works?
A formula can organise how you pick, but it cannot change the odds of the draw. Doubling after a miss runs through 1,000 coins after six misses in a row, and betting on a "due" colour scores about 50%. Try any formula in our free game and see the result over 200 rounds.
What does a hot number mean in colour prediction?
It is simply a frequent recent number. Each number has a 10% chance per round, and short samples always spread unevenly. In our 1,000 round sample the counts ranged from 88 to 112 around the expected 100, which is completely normal.
Reading charts is a hobby in itself, and it is at its best when you enjoy it with a clock in view and a fixed number of rounds, so that every session ends while the game still feels fresh and fun. Nothing on this independent guide involves deposits, stakes or cash prizes.
Last updated: